Even though High Frequency Trading seems to be all the rage amongst the big players, there still exists slower movements of the markets we smaller guys can play. For example, when trading indexes, there are some indicators available which help in selecting the time and direction of trades. Richard W. Arms, Jr. first codified this in a book called "The Arms Index", an indicator named after him.
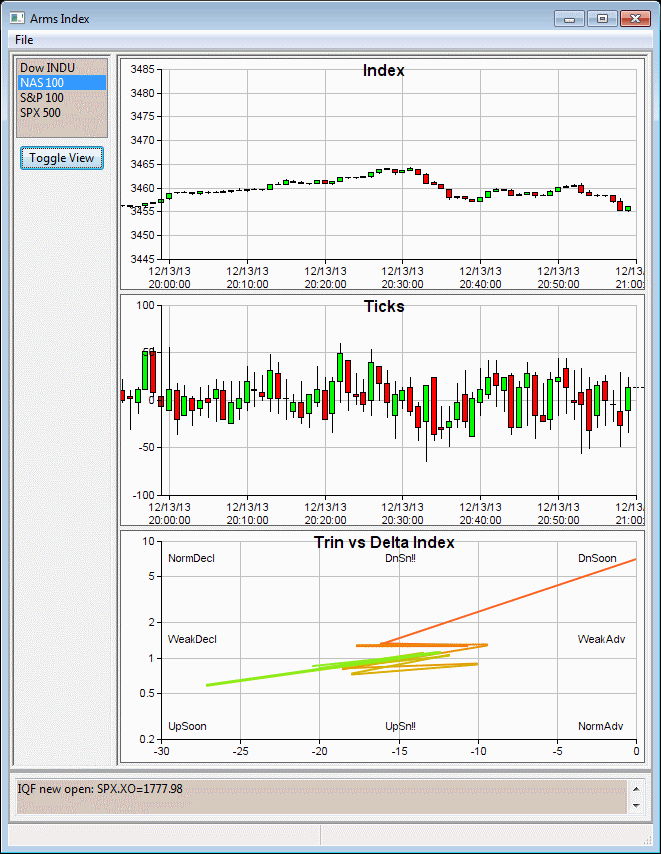
In the screen shot, the first chart shows the usual price action chart of an index, in this case, the Nasdaq 100, which includes the 100 of the largest domestic and international non-financial securities listed on The Nasdaq Stock Market based on market capitalization.
As each member security ticks up or down, the delta is recorded in the second of two charts, the Ticks chart. The Ticks chart is shows the
difference between the number of up-ticks and the number of down-ticks. In the majority, a positive number of ticks indicates a rising index, while a majority of negative ticks would indicate a generally falling index. Another things to notice is that the tick count rarely falls before a certain minimum, nor rises much above a certain maximum. When these extrema are breached, it can be sign of an index reversal, and could therefore be a tradeable signal.
The third chart represents the Arms Index, which is also known as the Trin, charted against the delta of the index. The Arms Index itself represents:
  # advancers
  ------------
  # decliners
---------------
  total volume of advancers
  -------------------------
  total volume of decliners
"By comparing advances and declines to the volume of trading occurring on those advances and declines it recognizes underlying pressures which are not appraent in just a price study". Indicies of greater than 1.00 or bearish, while indicies of less than 1.00 are bullish.
Taking the suggestions outlined in his book, I have written an application which visualizes this data for a number of different indexes. The application can be found at:
ArmsIndex64.zip. This is a 64 bit application for Windows, and requires an active
IQFeed data feed. If you are not a subscriber, and would like to subscribe to the feed, please let me know, and I can generate a
referral. If there is interest in a 32 bit version, please let me know, and I'll post a version.
As the chart updates in real-time, the current 'segment' tends to point to one of 8 regions on the chart. Each of the eight regions is labelled and provides an indication of the current index state, as well as where it might go in the future.
Current indexes charted are the following IQFeed symbols:
Note that depending upon your subscription level, some of the feeds may not be available, or they may be on a 20 minute delay.
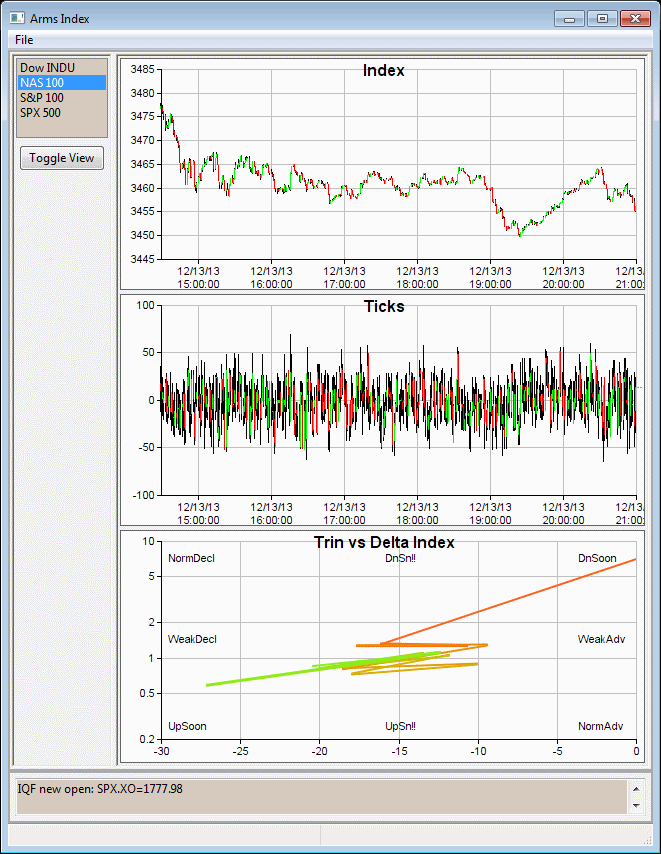
With the 'Toggle View' button, the last 60 minutes of the index and ticks feed are shown: